Welcome, Guest. Please login or register. Did you miss your activation email?

Author Topic: [solved] drawing in-place  (Read 1726 times)

0 Members and 1 Guest are viewing this topic.

Mortal

  • Sr. Member
  • ****
  • Posts: 284
    • View Profile
[solved] drawing in-place
« on: July 05, 2016, 10:17:16 pm »
hello

i'm working on demo for tile-based path-finder's algorithms. fortunately i found awesome tutorial about this subject with live demo, but it was written in javascript as shown here .

author provides C++ source code but it is ASCII console app. i tried to convert it to SFML-app but i had problem with draw the algorithm's processing. after many attempts i have come up with some thing like this .i know, it is awful, and there are many better ways to do it. but i can't wrap my head around it. in javascript, it seems an easy task. like this demo

i would like to know what is the best way to draw these kind of demos with SFML?
is there already open source for it?

thanks in advance

Edit:
SOLVED- i used vertex array. this is alone,  is enough to solve the render issue in my code.

« Last Edit: July 11, 2016, 01:29:53 am by Mortal »

Laurent

  • Administrator
  • Hero Member
  • *****
  • Posts: 32504
    • View Profile
    • SFML's website
    • Email
Re: drawing in-place
« Reply #1 on: July 05, 2016, 10:56:41 pm »
This is really vague, I don't know what kind of answer you expect.

What's so special about "these kind of demos", and what is your problem exactly?
Laurent Gomila - SFML developer

Mortal

  • Sr. Member
  • ****
  • Posts: 284
    • View Profile
Re: drawing in-place
« Reply #2 on: July 06, 2016, 12:45:16 am »
This is really vague, I don't know what kind of answer you expect.


Apologies for confusion, i always have english-language problems, but yeah, i will do my best to rephrase my question. hopefully i can clarify it this time.

i was referring to the demos as shown in the links, one of which is


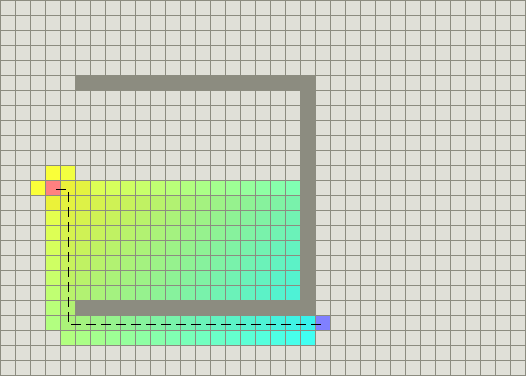
as shown above it is a 2D grid where the bink tile or "dim" is start point and blue is goal point. and the colourful area is the total tiles covered by Dijkstra’s algorithm as an example.

What's so special about "these kind of demos", and what is your problem exactly?

the main reason for me is it gives visual representation for any search algorithms and the user can test it against any circumstances to choose the proper algorithms. for example, the image above shows what may happen if A* algorithm faced a concave shape.

for second part of your question. my problem is with rendering the algorithms processing. i attended to do it by passing sf::RenderWindow to the class where the route function is at. and simply it draws whole grid for every iterations in the route function loop. this is obviously not the proper way to do it.

i was looking for better way to handle drawing. if there is a way to draw "in-place" as long as the route function loop is executing.